
New York State’s Labor Market, Summer 2026: The Calm Before the Storm?
Written by David Fischer for United Way of New York State
The big picture
Considering all the upheaval in the economy and labor market over the last year-plus, it is somewhat surprising that the underlying numbers have not moved all that much during that time.
Overall employment in New York State is relatively level compared to early 2025, and the job mix across sectors and occupations is mostly unchanged since then. But there’s reason to believe danger lies ahead: rising inflation is already adding pressure, and other disruptions—including immigration restrictions, changes to Medicaid and other social safety net programs, and the continuing implementation of AI—are likely to make themselves felt as well.
Unemployment rates
| May 2026 | April 2026 | May 2025 | |
| NYS unemployment rate | 4.6% | 4.6% | 4.2% |
| NYC unemployment rate | 5.4% | 5.6% | 4.8% |
| Rest of NYS unemployment rate | 3.9% | 3.8% | 3.4% |
| US unemployment rate | 4.3% | 4.3% | 4.2% |
Source: New York State Department of Labor, Division of Research and Statistics
Quick take: New York’s employment situation has slightly worsened since early last year, with the overall jobless rate up by nearly half a point. Statewide unemployment is rising at a somewhat faster pace than nationally. An increase in unemployment in New York City largely has driven the statewide rise, though as shown below, nearly every county in New York saw at least a slight rise before March 2025 and March 2026.
Understanding U-6 Rates: U-6 is a measure that the federal Bureau of Labor Statistics tracks capturing “labor underutilization”: all workers who are unemployed, involuntary under-employed—holding part-time when they would prefer to work full-time—and “discouraged,” meaning they are no longer actively looking for work. Over the last two years, New York’s statewide U-6 average has exactly tracked the national rate. New York City saw a slight decline in U-6 from 2023 to 2024.
U-6 rates
| U-6 rate, 2025 | U-6 rate, 2024 | U-6 rate, 2023 | |
| New York City | 9.4% | 9.4% | 9.8% |
| New York State | 8.0% | 8.0% | 8.1% |
| US | 8.0% | 8.0% | 6.9% |
Source: U.S. Bureau of Labor Statistics, “Alternative Measures of Labor Underutilization in New York – 2025”
NYS Employment by Sector
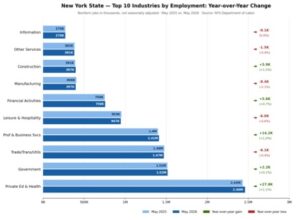
Source: New York State Department of Labor, Division of Research and Statistics
Quick take: Seven of the ten sectors that employ the most New Yorkers statewide lost jobs between May 2025 and May 2026. Manufacturing lost the most jobs on both a percentage basis (2.1) and in absolute numbers (-8,400). Trade, Transportation and Utilities (-6,100) and Leisure & Hospitality (-6,000) also saw significant employment declines
The only sectors that gained jobs were government, with a modest 0.1 percent increase (2,200 jobs), and private education & health—already the largest sector in the state—which saw employment growth of 1.1 percent (27,800 jobs). As detailed below, however, federal policy changes under the 2025 “One Big Beautiful Bill Act” (OBBBA) threaten continued job gains in healthcare.
NYS Employment by County
New York State, May 2025 vs. May 2026
(Not seasonally adjusted · sorted by size of change, largest increase first)
|
|
Source: New York State Department of Labor, Division of Research and Statistics
Quick take: Every one of New York’s 62 counties saw its unemployment rate rise between May 2025 and May 2026, though only four counties—Livingston (1.2), Allegany (1.1), Delaware (1.0), and Hamilton (1.4) saw increases of 1 percent or more.
Unemployment growth in the five counties of New York City was very mild: the Bronx jobless rate rose by 0.2 points, while the other four counties each saw a 0.1 percent increase. Statewide, the counties with the highest unemployment are the Bronx (6.5 percent), Hamilton (5.8 percent), Kings (4.9 percent), Allegany (4.7 percent), and St. Lawrence (4.7) percent. Yates County has the lowest unemployment rate at 2.9 percent.
What’s next
The economic headwinds being felt nationally have potential to bite harder in New York than elsewhere. The ongoing uncertainty of federal tariff policy over the last year-plus could have a negative impact across sectors that depend on international trade, as well as finance and professional services. Immigration enforcement poses another threat: employment is already down in sectors such as construction, manufacturing, and leisure/hospitality that employ large numbers of workers born outside the U.S., and more aggressive enforcement could further depress the labor supply.
But perhaps the most significant threat to New York’s labor market comes from the One Big Beautiful Bill Act. Passed by Congress in 2025 on a strict party-line vote, this legislation will impose significant cuts to Medicaid and other essential programs that serve as the foundation of New York’s social safety net. Hundreds of thousands of New Yorkers are at risk of losing health insurance as a result of the new law.
Reliable forecasters and trusted sources estimate that OBBBA cuts could eliminate 78,000 direct healthcare jobs statewide, with related economic effects that could wipe out an additional 136,000 jobs. Additional cuts to the Supplemental Nutrition Assistance Program (SNAP) are projected to reduce spending at small grocery stores—driving a fall in retail employment. Most of OBBBA’s most significant cuts go into effect toward the end of 2026, suggesting that 2027 could be a very challenging year for New York’s labor market.